Learning Analytics and AI
Descriptive Analytics of Reading Behaviors
Date
Team
2024
Individual work
My Role
Learning analyst
Target Users / Audience
Educators
Tools Used
Exploratory
Overview
This project involves an in-depth analysis of reading behaviors concerning two academic papers, Selwyn and Wise. Using data derived from CSV files on page visits, comments, and annotations, the project aims to provide insights into reading patterns and contribution quality. The final report includes both graphical visualizations and textual interpretations of the data, assessing how students interacted with the readings in terms of time, attention, and annotation quality.
1. Data Loading and Familiarization
The CSV datasets (Selwyn and Wise) are loaded into Exploratory, a tool for data visualization and analysis.
A summary of each dataset (pages visited, time of comments, annotations, annotation details) is created to understand the columns and data they contain.
2. Page Access Analysis
Line charts are created for both papers to represent the number of views and time spent on each page.
Trends and patterns are examined, comparing the two readings based on their respective page access metrics.
Differences in the length of the documents and their impact on attention span are analyzed.
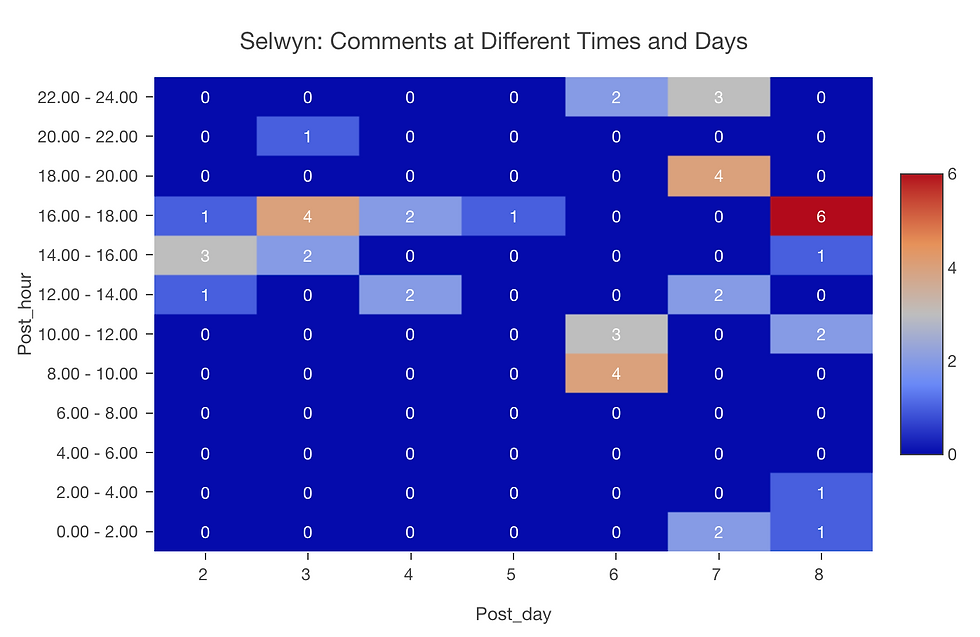
3. Comment Timing Analysis
A heatmap is generated for both readings using comment data, with time and day as categories.
The heatmap reveals the intensity of comments at different times, reflecting reading patterns and adherence to recommended reading schedules.
Comparisons between Selwyn and Wise readings are made to identify similarities and differences in activity timing.
4. Annotation Behavior Comparison
Datasets are transformed into a long format for better comparison between the Selwyn and Wise readings.
Bar charts are created to compare annotation behavior, including the number of posts, upvotes, and activity measurements.
Individual behavior is filtered and analyzed to understand how personal contributions varied across the two readings.
5. Contribution Quality Analysis
Various quality proxies, including the number of contributions, length, replies, and upvotes, are calculated and visualized in pivot tables.
Top contributors are identified for both readings, and the effectiveness of different proxies in assessing contribution quality is debated.
Process
Final Deliverable(s)
All visualizations and analyses are compiled into an Exploratory report, which is published online here: https://exploratory.io/note/nwb6AhO8eK/Assignment-I-Report-cAQ1jhI3iv